plot_data_channels
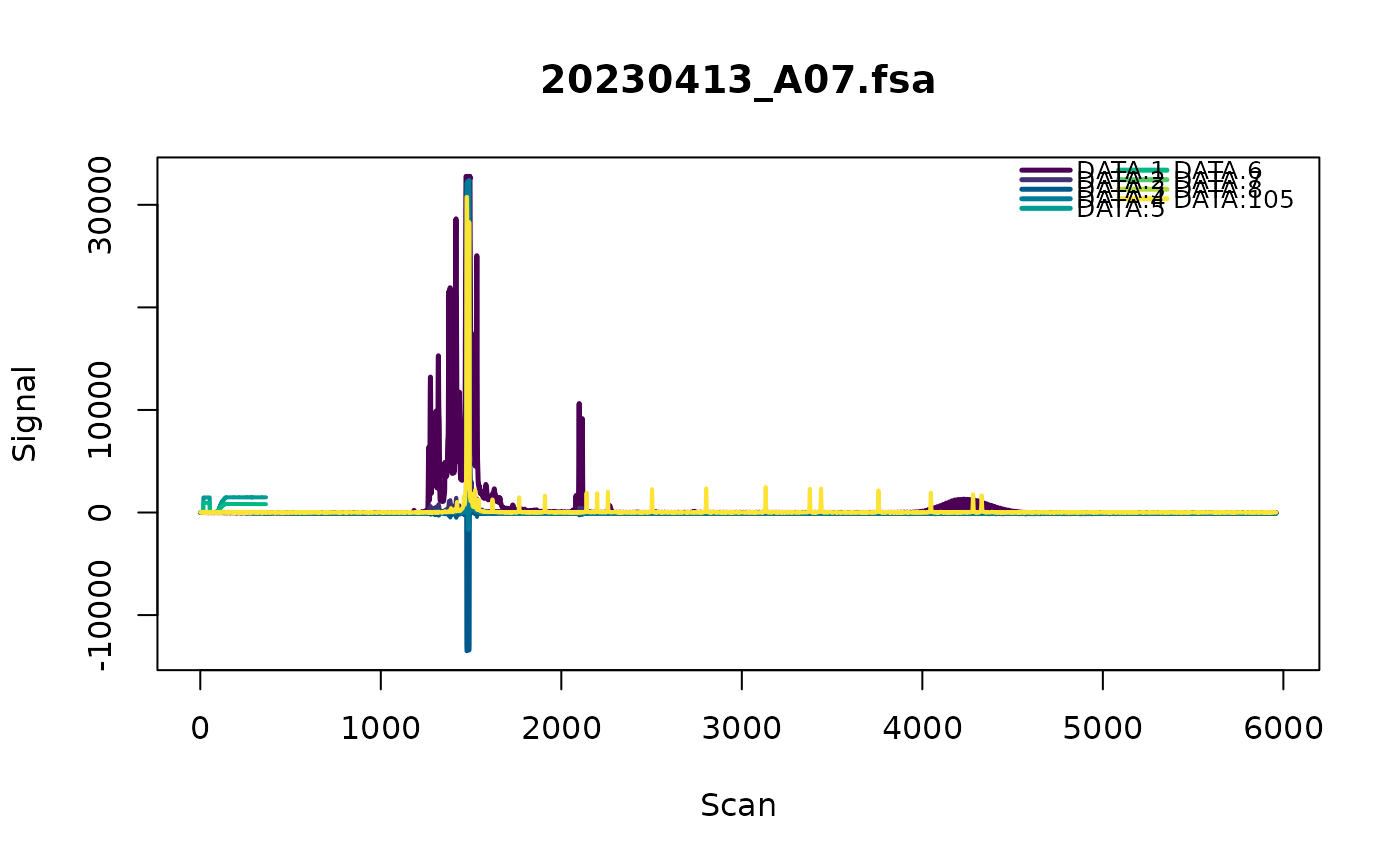
plot_data_channels.RdPlot the raw data from the fsa file
Details
A plot of the raw data channels in the fsa file.
These plots are made using base R plotting. Sometimes these fail to render in the viewing panes of IDEs (eg you get the error 'Error in plot.new(): figure margins too large)'. If this happens, try saving the plot as a pdf using traditional approaches (see grDevices::pdf). To get it to render in the IDE pane, trying matching n_facet_col to the number of samples you're attempting to plot, or using sample_subset to limit it to a single sample.
