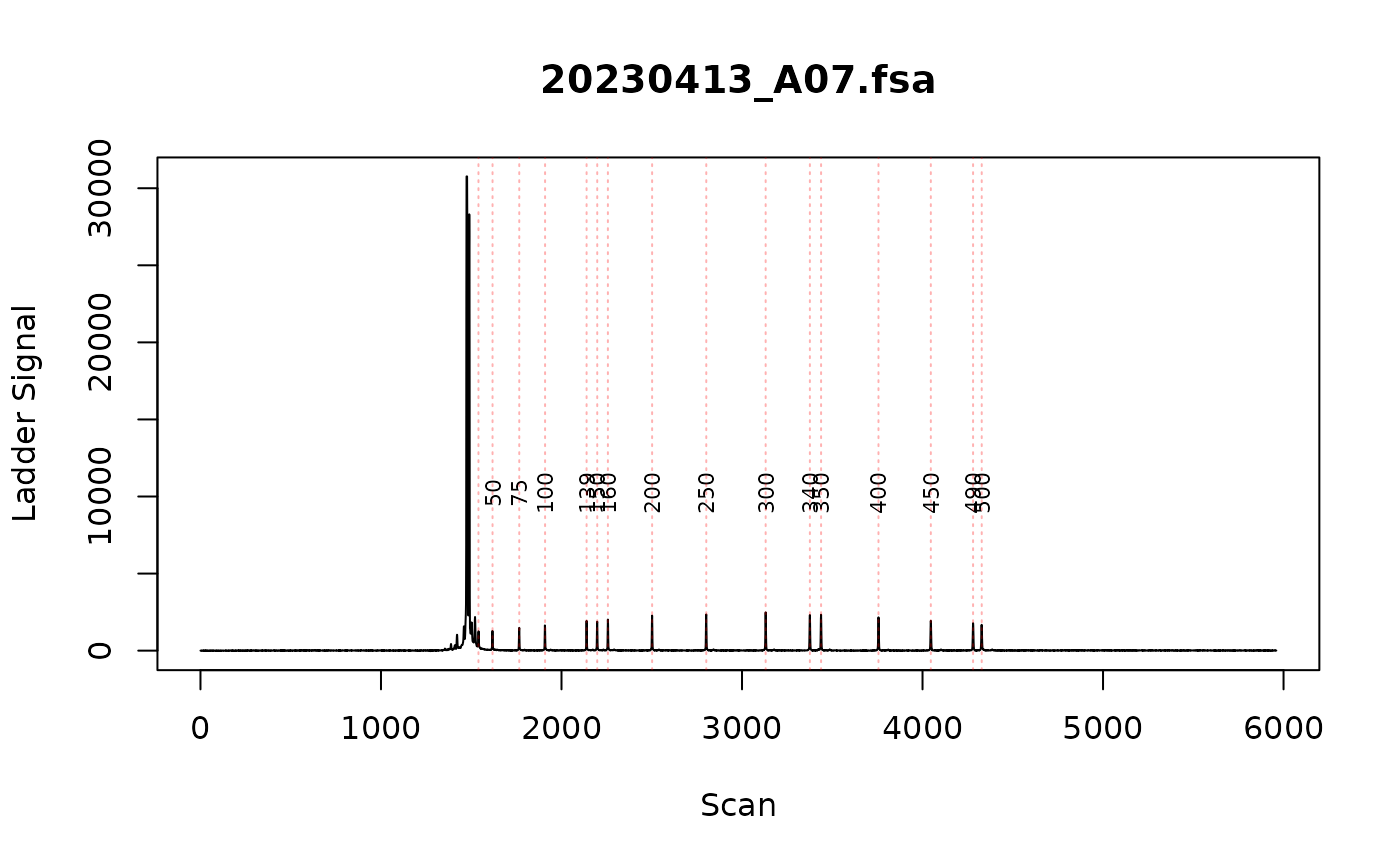
Plot ladder
plot_ladders.RdPlot the ladder signal
Usage
plot_ladders(
  fragments_trace_list,
  n_facet_col = 1,
  sample_subset = NULL,
  xlim = NULL,
  ylim = NULL
)
Arguments
- fragments_trace_list
A list of fragments_trace objects containing fragment data.
- n_facet_col
A numeric value indicating the number of columns for faceting in the plot.
- sample_subset
A character vector of unique ids for a subset of samples to plot
- xlim
the x limits of the plot. A numeric vector of length two.
- ylim
the y limits of the plot. A numeric vector of length two.
Examples
fsa_list <- lapply(cell_line_fsa_list[1], function(x) x$clone())

find_ladders(fsa_list, show_progress_bar = FALSE)

# Manually inspect the ladders
plot_ladders(fsa_list[1])
