Plot correction samples
plot_batch_correction_samples.RdPlot the overlapping traces of the batch control samples
Arguments
- fragments_list
A list of fragments objects containing fragment data. must have trace information.
- selected_sample
A character vector of batch_sample_id for a subset of samples to plot. Or alternatively supply a number to select batch sample by position in alphabetical order.
- xlim
the x limits of the plot. A numeric vector of length two.
Details
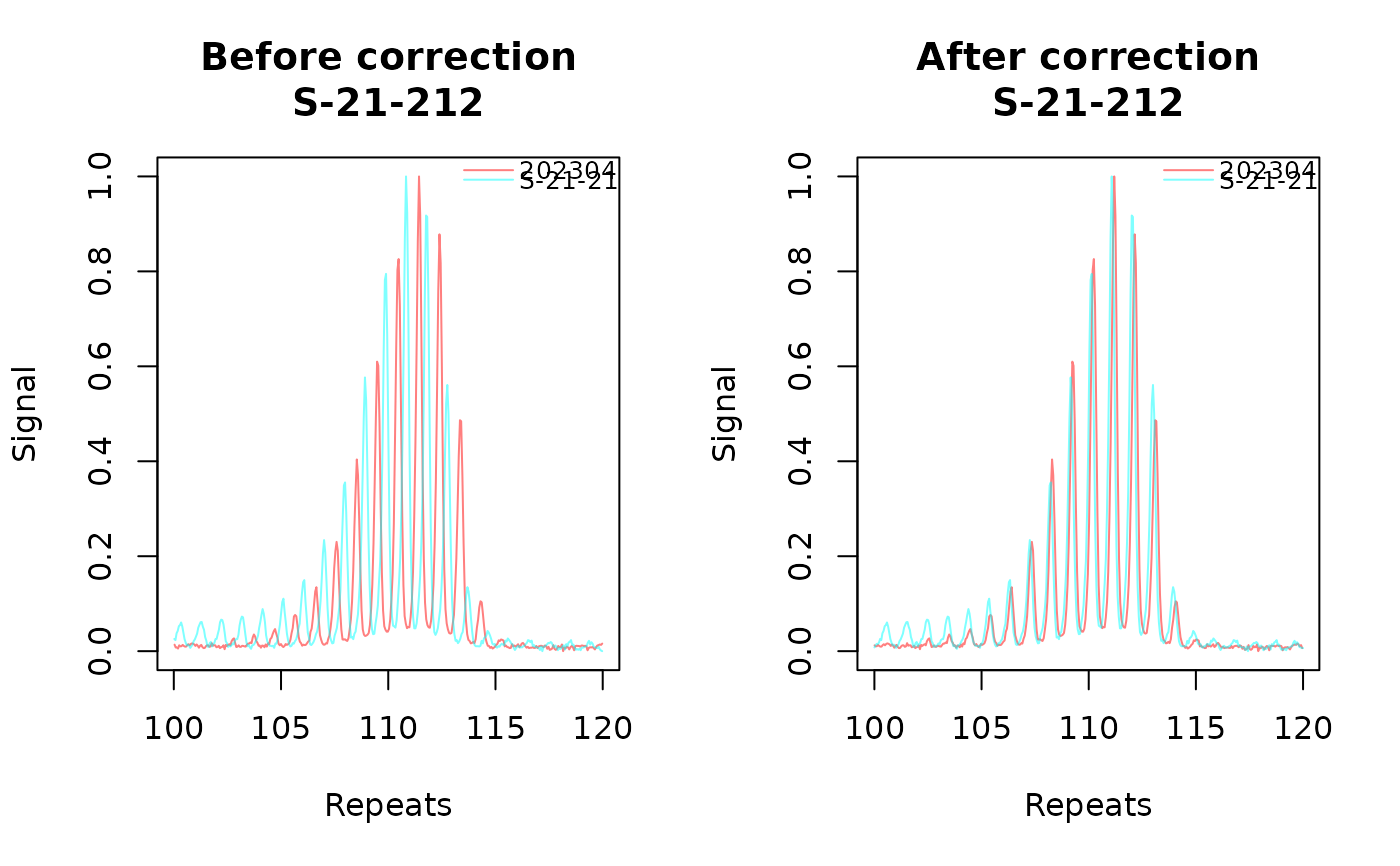
A plot of the raw signal by bp size or repeats for the batch correction samples.
When plotting the traces before repeat correction, we do not expect the samples to be closely overlapping due to run-to-run variation. After repeat correction, the traces should be basically overlapping.
These plots are made using base R plotting. Sometimes these fail to render in the viewing panes of IDEs (eg you get the error 'Error in plot.new(): figure margins too large)'. If this happens, try saving the plot as a pdf using traditional approaches (see grDevices::pdf).
See also
call_repeats() for more info on batch correction.
Examples
fsa_list <- lapply(cell_line_fsa_list, function(x) x$clone())
# import data with read_fsa() to generate an equivalent list to cell_line_fsa_list
fragments_list <- trace(fsa_list, metadata_data.frame = metadata, correction = "batch")
#> Finding ladders
#>
  |
  |                                                                      |   0%
  |
  |====                                                                  |   5%
  |
  |=======                                                               |  11%
  |
  |===========                                                           |  16%
  |
  |===============                                                       |  21%
  |
  |==================                                                    |  26%
  |
  |======================                                                |  32%
  |
  |==========================                                            |  37%
  |
  |=============================                                         |  42%
  |
  |=================================                                     |  47%
  |
  |=====================================                                 |  53%
  |
  |=========================================                             |  58%
  |
  |============================================                          |  63%
  |
  |================================================                      |  68%
  |
  |====================================================                  |  74%
  |
  |=======================================================               |  79%
  |
  |===========================================================           |  84%
  |
  |===============================================================       |  89%
  |
  |==================================================================    |  95%
  |
  |======================================================================| 100%
#> Finding fragments
#>
  |
  |                                                                      |   0%
  |
  |====                                                                  |   5%
  |
  |=======                                                               |  11%
  |
  |===========                                                           |  16%
  |
  |===============                                                       |  21%
  |
  |==================                                                    |  26%
  |
  |======================                                                |  32%
  |
  |==========================                                            |  37%
  |
  |=============================                                         |  42%
  |
  |=================================                                     |  47%
  |
  |=====================================                                 |  53%
  |
  |=========================================                             |  58%
  |
  |============================================                          |  63%
  |
  |================================================                      |  68%
  |
  |====================================================                  |  74%
  |
  |=======================================================               |  79%
  |
  |===========================================================           |  84%
  |
  |===============================================================       |  89%
  |
  |==================================================================    |  95%
  |
  |======================================================================| 100%
#> Finding alleles
#> Calling repeats
#> Correcting batch effects
#> Assigning index peaks


# traces of bp size shows traces at different sizes
plot_batch_correction_samples(
  fragments_list,
  selected_sample = "S-21-212", xlim = c(100, 120)
)
