Plot Peak Data
plot_fragments.RdPlots peak data from a list of fragments.
Usage
plot_fragments(
  fragments_list,
  n_facet_col = 1,
  sample_subset = NULL,
  xlim = NULL,
  ylim = NULL
)
Arguments
- fragments_list
A list of fragments objects containing fragment data.
- n_facet_col
A numeric value indicating the number of columns for faceting in the plot.
- sample_subset
A character vector of unique ids for a subset of samples to plot
- xlim
the x limits of the plot. A numeric vector of length two.
- ylim
the y limits of the plot. A numeric vector of length two.
Examples
fsa_list <- lapply(cell_line_fsa_list, function(x) x$clone())
# import data with read_fsa() to generate an equivalent list to cell_line_fsa_list
fragments_list <- trace(fsa_list)
#> Finding ladders
#>
|
| | 0%
|
|==== | 5%
|
|======= | 11%
|
|=========== | 16%
|
|=============== | 21%
|
|================== | 26%
|
|====================== | 32%
|
|========================== | 37%
|
|============================= | 42%
|
|================================= | 47%
|
|===================================== | 53%
|
|========================================= | 58%
|
|============================================ | 63%
|
|================================================ | 68%
|
|==================================================== | 74%
|
|======================================================= | 79%
|
|=========================================================== | 84%
|
|=============================================================== | 89%
|
|================================================================== | 95%
|
|======================================================================| 100%
#> Finding fragments
#>
|
| | 0%
|
|==== | 5%
|
|======= | 11%
|
|=========== | 16%
|
|=============== | 21%
|
|================== | 26%
|
|====================== | 32%
|
|========================== | 37%
|
|============================= | 42%
|
|================================= | 47%
|
|===================================== | 53%
|
|========================================= | 58%
|
|============================================ | 63%
|
|================================================ | 68%
|
|==================================================== | 74%
|
|======================================================= | 79%
|
|=========================================================== | 84%
|
|=============================================================== | 89%
|
|================================================================== | 95%
|
|======================================================================| 100%
#> Finding alleles
#> Calling repeats
#> Assigning index peaks
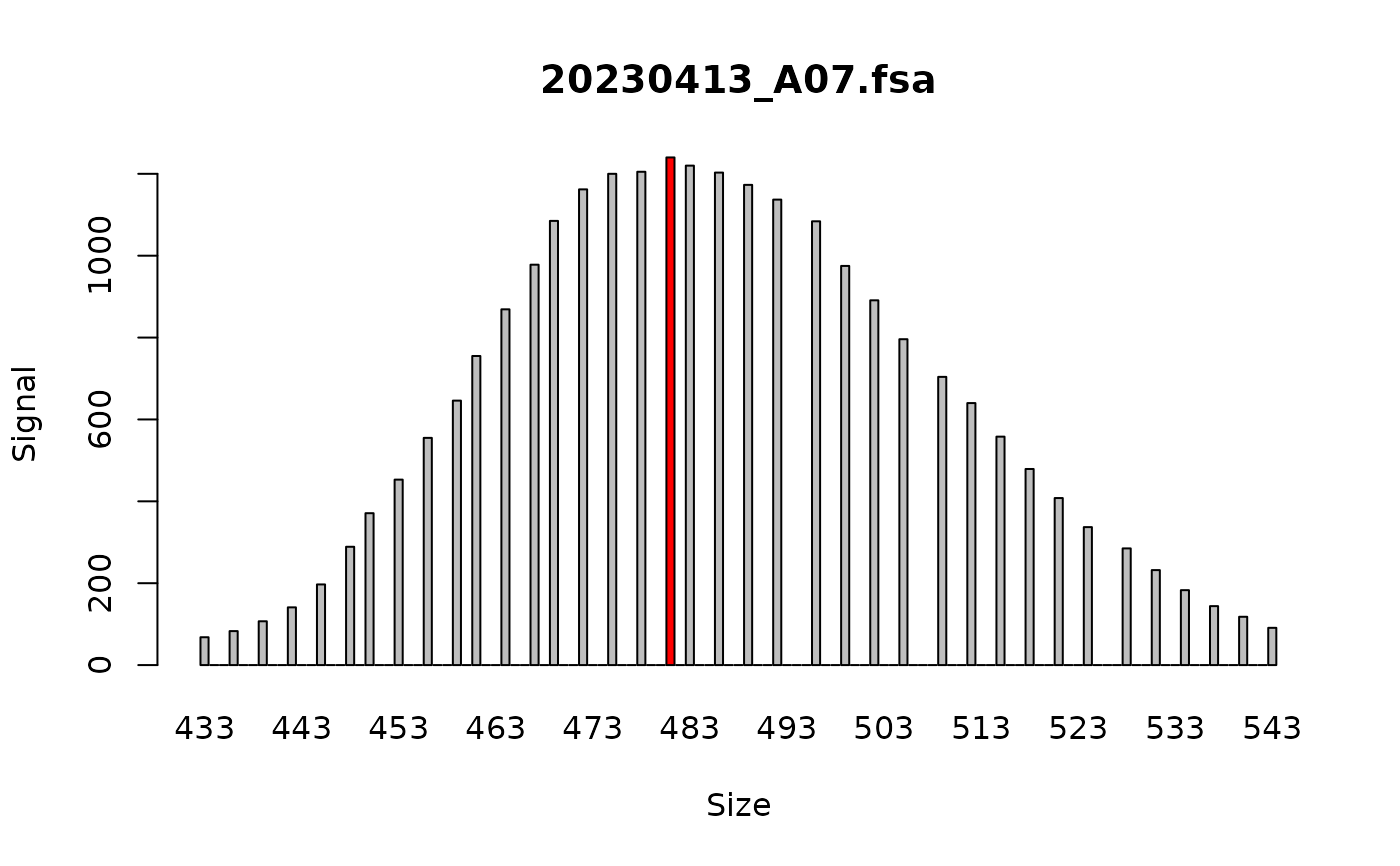
plot_fragments(fragments_list[1])