Plot Repeat Correction Model
plot_repeat_correction_model.RdPlots the results of the repeat correction model for a list of fragments.
Arguments
- fragments_list
A list of fragments class objects obtained from the
call_repeats()function when thecorrection = "repeat"parameter is used.- batch_run_id_subset
A character vector for a subset of batch_sample_id to plot. Or alternatively supply a number to select batch sample by position in alphabetical order.
- n_facet_col
A numeric value indicating the number of columns for faceting in the plot.
Details
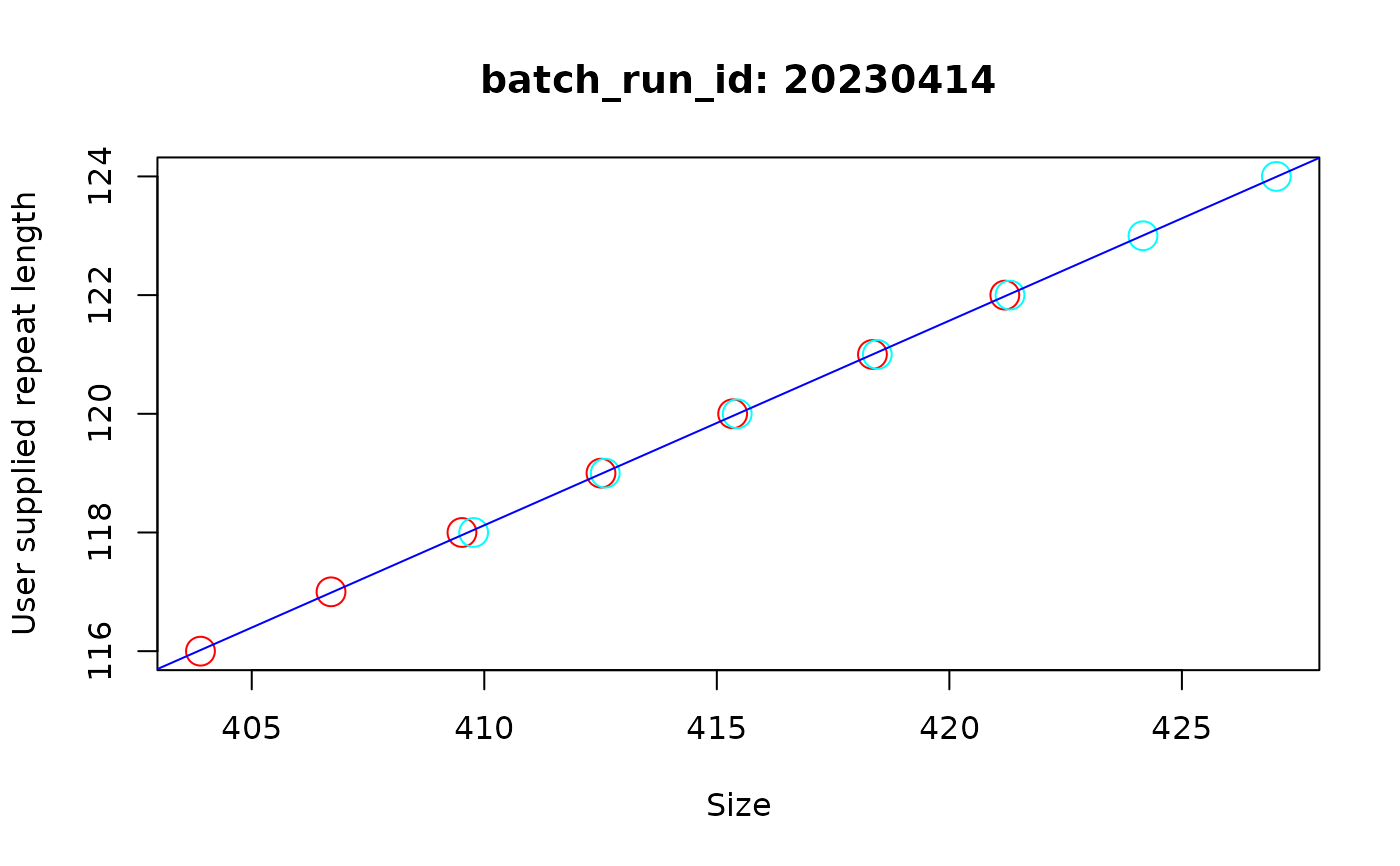
This function makes plots for the model used to correct samples for each batch_run_id. The repeat correction algorithm assigns the user supplied repeat length to the modal peak of the sample, then pulls out a set of robust neighboring peaks to help get enough data to build an accurate linear model for the relationship between base-pair size and repeat length. So on this plot, each dot is an individual peak, with the colour indicating each sample, with the y-axis is the repeat length called from the user-supplied value in the metadata and the value assigned to each peak, with the x-axis showing the corresponding base-pair size.
Examples
fsa_list <- lapply(cell_line_fsa_list, function(x) x$clone())
# import data with read_fsa() to generate an equivalent list to cell_line_fsa_list
fragments_list <- trace(fsa_list, metadata_data.frame = metadata, correction = "repeat")
#> Finding ladders
#>
  |
  |                                                                      |   0%
  |
  |====                                                                  |   5%
  |
  |=======                                                               |  11%
  |
  |===========                                                           |  16%
  |
  |===============                                                       |  21%
  |
  |==================                                                    |  26%
  |
  |======================                                                |  32%
  |
  |==========================                                            |  37%
  |
  |=============================                                         |  42%
  |
  |=================================                                     |  47%
  |
  |=====================================                                 |  53%
  |
  |=========================================                             |  58%
  |
  |============================================                          |  63%
  |
  |================================================                      |  68%
  |
  |====================================================                  |  74%
  |
  |=======================================================               |  79%
  |
  |===========================================================           |  84%
  |
  |===============================================================       |  89%
  |
  |==================================================================    |  95%
  |
  |======================================================================| 100%
#> Finding fragments
#>
  |
  |                                                                      |   0%
  |
  |====                                                                  |   5%
  |
  |=======                                                               |  11%
  |
  |===========                                                           |  16%
  |
  |===============                                                       |  21%
  |
  |==================                                                    |  26%
  |
  |======================                                                |  32%
  |
  |==========================                                            |  37%
  |
  |=============================                                         |  42%
  |
  |=================================                                     |  47%
  |
  |=====================================                                 |  53%
  |
  |=========================================                             |  58%
  |
  |============================================                          |  63%
  |
  |================================================                      |  68%
  |
  |====================================================                  |  74%
  |
  |=======================================================               |  79%
  |
  |===========================================================           |  84%
  |
  |===============================================================       |  89%
  |
  |==================================================================    |  95%
  |
  |======================================================================| 100%
#> Finding alleles
#> Calling repeats
#> Repeat correction model: 4 samples used to build model
#> Repeat correction model: 2.87 bp increase per repeat
#> Assigning index peaks

# traces of bp size shows traces at different sizes
plot_repeat_correction_model(
  fragments_list,
  batch_run_id_subset = "20230414"
)